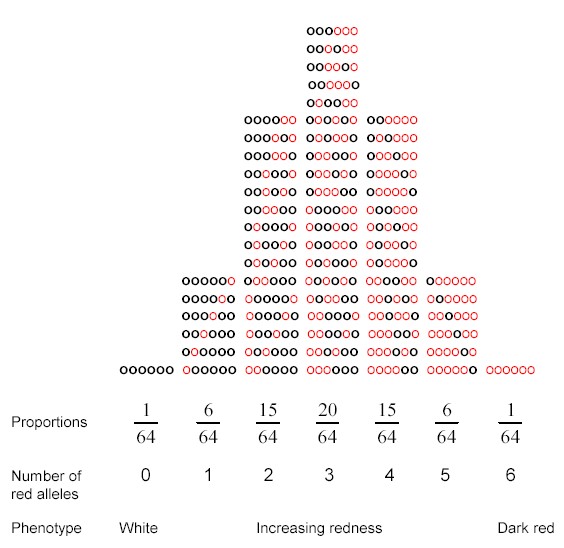
Figure 12.1: Kernel colour in the F2 generation of a cross between a white and a dark red variety of wheat. The colour difference is assumed to be due to 3 gene loci, and each red allele is denoted ![]() and each while allele is denoted
and each while allele is denoted ![]() . The 64 possible combinations of alleles are grouped into the seven possible phenotypes, which occur in the proportions shown.
. The 64 possible combinations of alleles are grouped into the seven possible phenotypes, which occur in the proportions shown.